Well the MuPhoria second edition has ended now I
want to explain some of approaches that can be used to solve the problem. I
think there may not be an unique solution of the problem. The solution may vary
depending upon the approach followed. The problem is quite related to real life
and expect you to get a reasonable solution.
At first I would like you to have a overview of the problem statement :
Problem Statement:
At first I would like you to have a overview of the problem statement :
Problem Statement:
You have been appointed the Chief Procurement
Officer of Vada Pavs R Us. We are the nation’s leading manufacturers of Vada
Pavs. For one of our flagship stores, we’d like you to purchase all the
potatoes, chillies and other assorted ingredients that go into making the
nation’s favorite snack. If you thought French cooking was difficult, wait till
you see our patented recipe (see worksheet "Vada Pav Recipe" in the Dataset).
We've been consistently ranked the nation’s top
seller of Vada Pavs (see worksheet "Historical Sales" in the Dataset). We'd like you to
make sure that our chefs have all the ingredients that they need. They’re
really cranky – our last procurement officer messed up supply this one time and
no one’s heard of him since. We’re also trying to locate a barrel of oil that
went missing around the same time.
Our suppliers are known to be a capricious lot.
They raise prices before you can say 'extra mirchi' and we've tried not to be
too dependent on any one of them (See worksheet "Supplier Details" in
the Dataset). Our ingredients
are sourced from all corners of the known universe and our supply chain has to
contend with tin-pot dictators, cyclones and other forces of nature. To help
you do your job better we have attached all the orders that we have placed over
the last 72 weeks. (worksheet "Historical Order Summary" in the Dataset).
Here's what we need you to do. Ensure that demand
is met adequately and that our stocks are fresh. Did we mention that you also
have to ensure that our costs (all of them - procurement, storage and wastage)
are kept down to the lowest extent possible? Each and every customer is
important so try to keep the loss of sales to a minimum. We’d like you to take
a look at our historical sales trends and help us come up with a daily buy plan
– the units of raw material that we need to procure in order to meet the demand
(estimated by you), the prices at which we should purchase them and the times
of purchase for each of the goods. You can use the template as given in
worksheet "Order Balance Sheet" in the Dataset.
Here are a few hints to get you
started:
·
Objective: Minimize total monthly cost.
That is, minimize the sum of procurement cost, inventory storage costs, wastage
and lost sales
·
Procurement = Price of unit (on that day) x No. of units to be procured
·
Inventory storage cost = Inventory holding cost (per unit) x No. of
units in inventory at the end of each day
·
Wastage cost = Disposal cost / unit x No. of units expired (Only for
expired material)
·
Lost sales = Selling price x Units of unmet demand
·
Expected output: A daily buy plan (for a month)
Assumptions:
·
Orders for a fresh planning cycle in July will have to be placed
starting July 1st
·
A fixed quantity of each commodity will be provided on the first of the
month, to ensure that the store is up & running from the first day of the
month
·
Inventory ordered on the basis of previous month’s buy plan cannot be
carried forward to the next month and will be considered as wastage or
accounted under inventory storage costs
·
Shelf life for a product starts from the day they are received (ignoring
transportation time)
You can see the graph in data sheets and can observe that there have been various up downs in corresponding months.
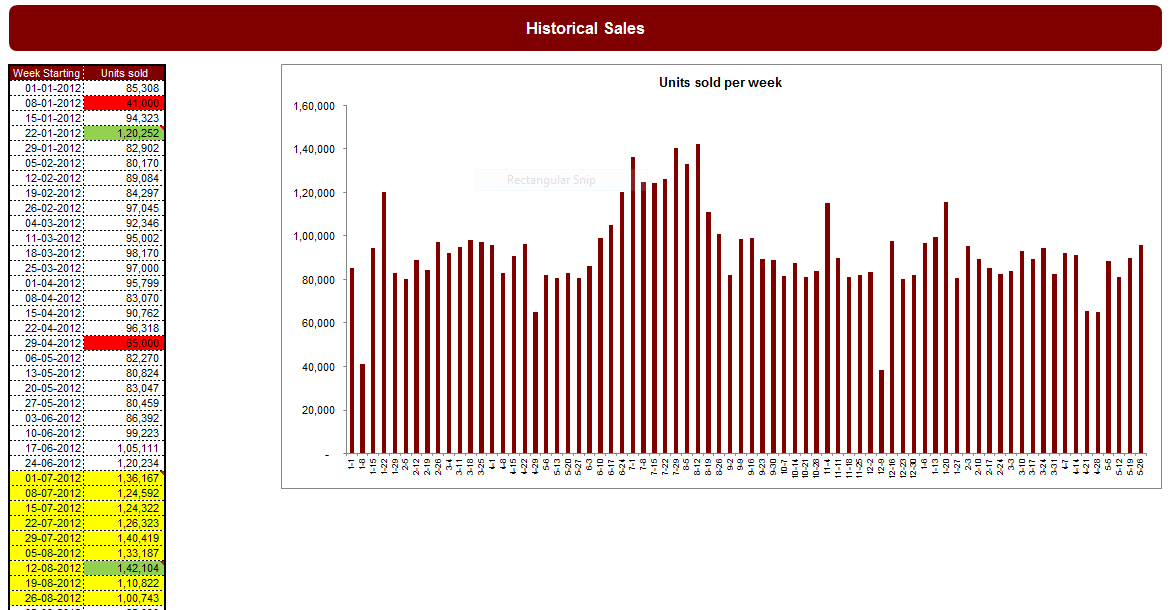
There have been holidays, strikes, seasonal festivals, and other trends which
affect demand as well as other things largely. Like on a day of strike you
goods won’t arrive. You might get a huge sale of Vada Pavs on a festive day. So
these thing must be considered while forecasting the demand.
Approach1(Naïve):
The naïve approach of solution is to see the trends of previous year of the month to be forecasted and you can take a mean of the sale and standard deviation. Depending upon the mean and standard deviation forecast the sale of each day of month equally. Also add some extra demand to the day of special importance like a festive day or holiday or something else. While doing this keep track of the existing goods and depending upon the requirement of goods on a particular day place the order of item on lead time (as given in the data sheets) before. Also since lead time is varying quietly so keep a counter to switch the lead time also. There are multiple seller of a particular item so regularly change the seller so that no seller gets overwhelmed with the demand and increase the price of item they are selling.
Approach2:
We can use a
simulation software WEBGPSS. It is a
general purpose simulation software.You can download this software at :
You
might not find enough tutorial on this on internet but this can be used to
forecast and generate various report by doing a little bit of practice. The WEBGPSS contains a number of built in function (e.g.
normal distribution function ) which can be used to distribute data over the
period of demand. This generates a report as formatted by you.Later you can
manually put the forecasted value on the attached answer sheet or programmatically generate the report.
Check here a complete post on how to use WEBGPSS to find a solution of MuPhoria
second edition.
The data given contains a lot of
variations and exhibits different trends. One approach is to use
time-series-analysis of data. Time series forecasting is the method that can be
used to get a solution that can give you very close solution.
Watch these three videos to get enough idea on how to use time series forecasting. You need to prepare data accordingly to forecast.
Watch these three videos to get enough idea on how to use time series forecasting. You need to prepare data accordingly to forecast.
Safety stock is another thing
which must be considered while placing the orders for the demand of goods. Your
inventory must have some goods to run the shop in case there happens an
unexpected strike or demand is greater than what forecasted. Although this
will lead you to some holding cost but your customers will be happy which is
what you desire.
It was a great experience to solve the problem of MuPhoria second edition. It got me a lot of things to learn and earn also.
If you have one, do share your approach also!
It was a great experience to solve the problem of MuPhoria second edition. It got me a lot of things to learn and earn also.
If you have one, do share your approach also!


No comments :
Post a Comment